 The“change in private inventories” is the contributions of change in private inventories to the annualized percent change in real GDP of U.S. PMI is the purchase manager index. The graph is from the beginning of PMI publication in 1948 to March 2009. The pattern from the chart is clear and intuitive. Whenever PMI dropped below 50, it means that the level of manufacturing activities drops compared to the previous month, manufacturers reduce production, and let the inventory adjust. When inventory runs down to a level that it no longer satisfies the final demand, the production can resume again. This is just economics 101. Plain and simple.
The question is: have we reached the point that the production needs to be resumed again?
Look at the chart. Since the monthly published PMI is a more timely indicator than the quarterly published GDP number, the expected huge negative inventory adjustment in the first quarter in 2009 has not shown up in the chart yet. But based on the history of PMI and GDP lines from the chart, every time PMI dropped below 40, inventories contributed to about average 5% of contraction of GDP. Given this pattern, recent data on international transportation (http://www.joc.com/node/409860), and recent huge promotion seen in U.S. retail businesses, the adjustment on inventory is surely under way now. Also, ISM inventories dropping fast in the first quarter of 2009 is another piece of evidence of the adjustment in inventories. In Chart 2, ISM new orders and inventories are presented.
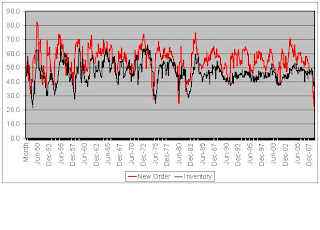 You can see that new order series is always one step ahead of inventory series. New orders series recently just recovered from the below 30 level back to 41.2 in March. This means the number of new orders are still declining, but at a smaller pace. Notice that inventories index is now 32.2. Historically speaking, when new orders index has been lower than 30, the inventory index will also go down to the level of 30. It seems that the inventory is near the bottom now.
When the warehouse is empty, productive activities will begin to accelerate from the now distressed level. The economic indicators will certainly turn more positive and the sentiments will be more optimistic, at least for a while. Therefore, I expect the consumer confidence and consumption will drop at a slower pace and then rise gradually for the next few months. The implication for the supply chain is that more new orders will slowly begin to show up.
One last observation on the Chart 1, the downward trend of PMI peaks and the upward trend of inventory adjustment bottoms showed that the U.S. moved away from manufacturing during the past six decades. It coincides with the fact that inventories index is more volatile before 1990 and less volatile after 1990. It could well be that the supply chain management has been more efficient. Or, these suppliers are no longer in U.S. So, what does the picking-up in PMI means to those foreign suppliers?
The final question is: Now we have more and more protectionism, will this outsourcing trend continue? And if not, what are the impacts?
No comments:
Post a Comment