Friday, April 24, 2009

Korean Automaker Made a Big Investment in the South

A few days ago, New York Times has article on Korean car maker’s investment in U.S. (see http://www.nytimes.com/2009/04/22/us/22kia.html?ref=global-home). A few things really catch my attentions. First, Korean auto manufacturers, like Japanese auto manufacturers, mostly set up their plants in the southern states of U.S (in this case, a small town of 3000 people). &n bsp;As late entrants, why did East Asian car markets choose southern states in U.S.? How did they pick those locations? Apparently union is one of the important reasons. But there are other reasons to choose southern states over other states. I will write a more detailed analysis next time. The second point is that the article mentioned that “In the case of Kia, which is based in South Korea, state and local officials doled out some $400 million in tax breaks and other incentives.”

Actually, almost every state has some investment tax incentives to attract business investment. Since the investment opportunity is so precious now that state and local governments also are willing to dole out additional public subsidies.

Recently, I collect some investment tax incentives from several Midwest states. I choose Midwest because this is a region that is traditionally specialized in manufacturing.
Five states that have Investment Tax Credit programs are analyzed here. While each program is unique there are some similarities (see Table 1).


Table 1


All five states have some Enterprise Zone or special zone programs, which are aimed to direct investment to specific communities and locations. The other similarity is that most states award tax credits based on the additional economic activity induced by the investors. The usual measurements for the additional economic activity include the minimum investment criteria, the number of new jobs, and the average wage of new jobs. The Enterprise Zone Program in Iowa provides a basket of public incentives, such as a property tax exemption, a supplemental New Jobs Credit (260E), a sales and use tax refund to the construction period, an Investment Tax Credit, and a supplemental Research Activities Tax Credit. Illinois’s enterprise zone program offers an Investment Tax Credit equal to one half of one percent of the value of qualified property, a sales tax exemption, and an enterprise zone tax credit for new jobs created (Illinois Department of Commerce and Economic Opportunity). Indiana’s enterprise zone program only offers credits for increased wages of local employees in private companies in the enterprise zone. Nebraska has programs specially aimed to promote investments in rural areas. For Wisconsin, both investment and the new jobs are awarded with the tax credits.


Final point is that the list in the table does not include all incentive programs that promote business investment in those states. More often, the terms and conditions of public incentives are subject to negotiation. For those big name investors with deep pockets, asking the governments to tailor a new tax incentive for them is a quite normal practice.

Thursday, April 16, 2009

FDI in biotech industry in U.S.: Make Decision under the New Regulatory Environment

A few days ago, NeoStem, Inc. (AMEX: NBS) received a total $11 million investment from three Asian companies, including a Shanghai based investment company. NeoStem, Inc. is a biotech company which “manages a network of adult stem cell collection centers in major metropolitan areas in the United States, enabling people to donate and store their own (autologous) stem cells when they are young and healthy for their personal use in times of future medical need. The Company also has entered into research and development through the acquisition of a worldwide exclusive license of technology to identify and isolate VSEL(very small embryonic-like) stem cells, which have been shown to have several physical characteristics that are generally found in embryonic stem cells.”

This investment coincides with the dramatic change in the big picture: President Obama lifted the ban on federal funding for embryonic stem cell research on March 9, 2009. This new order gave a big boost on biotech research communities, in addition to more commitments on government funding for general biotech research.

Previously, the U.S. only allowed the federal funding for adult stem cell research. It was reported that the U.S. has already initiated a clinical phase II study of adult stem cell-derived drugs that could treat chronic heart disease and, for the first time in the world, authorized a clinical trial of embryonic stem cell drugs that could treat spinal injuries. (http://joongangdaily.joins.com/article/view.asp?aid=2903044).

The traditional business model for big pharmaceutical companies has already been broken. Currently, the average R&D period of a new drug is about 12 years and the successful rate of new drugs development is about 2-3%. On the other hand, the revenue from new drugs is reduced because the generic drug producers can undercut the prices and markets just a few years later. Thus, the cost per patient under this business model is prohibitively high, which is impossible under the current U.S. healthcare system. Many of these challenges facing the drug industry compelled the industry to find ways to cut cost, i.e. outsourcing clinic trials to China and India.

The same problems also appear in biotech field. In long term, stem cell research is called the one of the most promising areas that is expected to generate numerous marketable new drugs and new therapies. One application is for treatment of neurogenerative diseases, such as spinal muscular atrophy, Lou Gehrig's disease and Parkinson's. However, in short term, the stem cell research very much relies on government funding and venture capital.

To reverse the outsourcing trend in pharmaceutical industry in U.S., foreign investors considering investing in U.S. biotech field usually have a few reasons: techniques and patents; closed to U.S. market (especially crucial for FDA applications); and closer to a capital market (dysfunctional now but could be helpful in the future).

There are only a few places in U.S. that are suitable for such goals, such as California, New Jersey, New York, Massachusetts, and Wisconsin. All these states have strong legal supports on stem cell research. While other states might support general biotech research, many banned public funding for stem cell research particularly. More importantly, these states have a large pool of talents, top universities and research facilities that are devoted to life science research. As a result, pharmaceutical industry and medical communities have strong presence in these places. Setting up an office or acquiring a biotech company there is a necessary step if one wants to get in the game.

The stem cell research and application industry is still a much fractured segment. Because the stem cell research currently is still in the lab stage, marketable commercialized products are much farther away on the horizon. Major revenue sources for this industry include government funding and private venture capital. However, there is still room for private companies to make profits. As the investment mentioned at the beginning of the article, NBS is an adult stem cell supplier and bank, which could be commercially viable because demand for its products is likely to rise due to increasing funding for research. Likewise, there are other investment opportunities in this market. It all depends on your advantages and position in the industry.

Thursday, April 9, 2009

An Analysis on Foreign Direct Investment in U.S.: Industries and Countries, Part 2

Now let us look at the operating performances of Chinese FDI in U.S.

The overall performance of China’s FDI in U.S. was disappointed so far, based on the data available between 2003 and 2007. The aggregate net income from China’s FDI was -$20 million in 2003, $66 million in 2004, $11 million in 2005, -$29 million in 2006, and $38 million in 2007. Actually, U.S. BEA changed the net income definition from net income after withholding tax deduction to net income before withholding tax deduction in 2006. Thus, the net income of China’s FDI should be lower in 2006 and 2007 if the definition is consistent.

As a comparison, net income from Asia and Pacific Region was $8.5 billion in 2003, $16.3 billion in 2004, $18.4 billion in 2005, $24.7 billion in 2006, and $26.9 billion in 2007. In addition, China fell behind almost all its major economic competitors in this category, which includes Japan, South Korea, Hong Kong, Taiwan, Singapore, and India. Net income of China’s FDI only accounted a faction of these economies’ net income from their FDI in U.S. in 2007.

If we take the total investment into consideration, return of investment (ROI) of China’s FDI was -7% in 2003, 15% in 2004, 2% in 2005, -3% in 2006, and 3% in 2007. For Asia and Pacific Region, ROI of FDI was 4% in 2003, 7% in 2004, 7% in 2005, 9% in 2006, and 8% in 2007. Except for 2004, ROI of China’s FDI was far below other economies’ in the region. This partly explained why China’s FDI in U.S. is still low. When previous investment did not generate a good return, Chinese investors may be lack of confidence to invest more.

Next we look into industries in which China’s FDI concentrated. Wholesale, manufacturing, and other industries are three sectors that China’s FDI had concentrated in so far. For wholesale sector where received the most China’s FDI in U.S., Chinese ROI is petty low compared to the overall average ROI in U.S (see Table 1).

Table 1

For manufacturing, only 2003 and 2007 data are available now. In both years, China’s FDI in U.S. manufacturing sector had negative net income. Among all industries in manufacturing sector, “Primary and fabricated metals” industry has $4 million net income in 2007, which is the highest net income in manufacturing sector from China’s FDI.

For other industries, which generally include agriculture, forestry, fishing, and hunting; mining; utilities; construction; transportation and warehousing; administration, support, and waste management; health care and social assistance; accommodation and food services; miscellaneous services ; and holding companies (nonbank), China’s FDI had a better performance in recent years (see Table 2).

Table 2

At last, why did China’s FDI in U.S. produce such a poor performance? More about this issue later.


Friday, April 3, 2009

An Analysis on Foreign Direct Investment in U.S.: Industries and Countries

The biggest foreign investor group is European, especially Western European. About 71% of total foreign direct investment (FDI) in U.S., which is about $1,483 billion, comes from Europe up to 2007. But the number could be a little tricky here. Among the European countries which make investment, some are clearly used as the offshore tax havens to structure the investment in U.S., i.e. Luxembourg, which accounts for nearly one-tenth of that $1,483 billion European investment. The top three European countries to invest in U.S. till 2007 are United Kingdom, Netherlands, and Germany.

Asia and Pacific countries’ investment only accounts for 15% of FDI in U.S., which is about $320 billion. Not surprisingly, Japan is the largest Asian investor (the second largest in the world) in 2007. Japanese invested totally about $233 billion in U.S. by the end of 2007. The next tier of East Asian investors includes South Korea and Singapore. Both countries had invested more than $10 billion in U.S. by the end of 2007. The third tier includes regions and countries like Taiwan, Hong Kong, India, and China mainland. All of them had invested between $1 billion and $10 billion in U.S.

Looking at the industries that received FDI in U.S., European had spent the most money on manufacturing in U.S., which is about 38% of their investment ($557 billion). But investors from Asia and Pacific region had only spent 31% on manufacturing ($98 billion). What Asian investors liked most is the wholesale industry, which received about $114 billion from Asia and Pacific region (36% of FDI from Asia and Pacific region).

The differences in investment destinations between Western European and East Asian are so obvious. The Asian investment in distribution channels and marketing is to serve their domestic manufactures and exporters to gain greater access to U.S. market. European invests more in manufacturing probably because they want to avoid exchange risks in addition to gaining access to U.S. market. Furthermore, European investment has been more diversified than Asian investment in recent years. Between 2002 and 2007, manufacturing and wholesale sectors only accounted for about 41% of the total FDI from Europe. Financial industries and other industries accounted for another 50% of the FDI from Europe.* But for Asian investment, manufacturing and wholesale sectors together accounted for 76% of the FDI from Asia and Pacific Region between 2002 and 2007.

At last, let’s take a look at China’s direct investment in U.S. China’s total FDI in U.S. is very small compared to other major foreign investors. Similar to other major Asian exporters, China’s investment is concentrated in manufacturing and wholesale sectors. Till 2007, China had $847 million invested in wholesale industry in U.S., compared to the total investment of $1,091 million. Most of China’s wholesale investment ($501 million) happened in 2005. The manufacturing sector, chemicals ($89 million) and primary and fabricated metals ($126 million) are two largest industries that received a lot of Chinese investors’ attention. Outside manufacturing and wholesale sectors, China has $73 million investment in professional service and $111 million investment in other industries.

Data source: www.bea.gov (All dollar amounts are on historic cost base.)

* other industries is defined as industries other than manufacturing, wholesale, retail, financial services, information, real estate, and professional services.

Thursday, April 2, 2009

Inventory and PMI: the prediction on U.S. manufacturing

Yes, yesterday’s ISM manufacturing index on March was 36.3. The number was higher than last month and just a little above the lowest one (which means the manufacturing activities deteriorated A LOT.) in the more than 20 years. However, what the number did not say is that the short-run turnaround is upon us. Let’s look at the historic ISM manufacturing index and inventory numbers. See the following chart:

Chart 1


The“change in private inventories” is the contributions of change in private inventories to the annualized percent change in real GDP of U.S. PMI is the purchase manager index. The graph is from the beginning of PMI publication in 1948 to March 2009. The pattern from the chart is clear and intuitive. Whenever PMI dropped below 50, it means that the level of manufacturing activities drops compared to the previous month, manufacturers reduce production, and let the inventory adjust. When inventory runs down to a level that it no longer satisfies the final demand, the production can resume again. This is just economics 101. Plain and simple.

The question is: have we reached the point that the production needs to be resumed again?

Look at the chart. Since the monthly published PMI is a more timely indicator than the quarterly published GDP number, the expected huge negative inventory adjustment in the first quarter in 2009 has not shown up in the chart yet. But based on the history of PMI and GDP lines from the chart, every time PMI dropped below 40, inventories contributed to about average 5% of contraction of GDP. Given this pattern, recent data on international transportation (http://www.joc.com/node/409860), and recent huge promotion seen in U.S. retail businesses, the adjustment on inventory is surely under way now. Also, ISM inventories dropping fast in the first quarter of 2009 is another piece of evidence of the adjustment in inventories. In Chart 2, ISM new orders and inventories are presented.

Chart 2


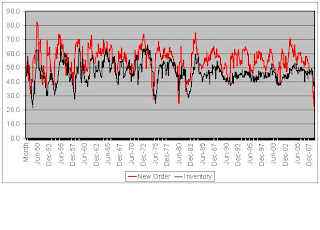
You can see that new order series is always one step ahead of inventory series. New orders series recently just recovered from the below 30 level back to 41.2 in March. This means the number of new orders are still declining, but at a smaller pace. Notice that inventories index is now 32.2. Historically speaking, when new orders index has been lower than 30, the inventory index will also go down to the level of 30. It seems that the inventory is near the bottom now.


When the warehouse is empty, productive activities will begin to accelerate from the now distressed level. The economic indicators will certainly turn more positive and the sentiments will be more optimistic, at least for a while. Therefore, I expect the consumer confidence and consumption will drop at a slower pace and then rise gradually for the next few months. The implication for the supply chain is that more new orders will slowly begin to show up.


One last observation on the Chart 1, the downward trend of PMI peaks and the upward trend of inventory adjustment bottoms showed that the U.S. moved away from manufacturing during the past six decades. It coincides with the fact that inventories index is more volatile before 1990 and less volatile after 1990. It could well be that the supply chain management has been more efficient. Or, these suppliers are no longer in U.S. So, what does the picking-up in PMI means to those foreign suppliers?


The final question is: Now we have more and more protectionism, will this outsourcing trend continue? And if not, what are the impacts?


The reasons of foreign direct investment in U.S.

When everybody is outsourcing and U.S. banks is failing every week, why does anyone want to invest in U.S., especially as a foreigner?


The answer is always MONEY.


If one can make an above opportunity cost return, it is always a good idea for one to put his money on the table. The key is to study the possibilities thoroughly, plan the move carefully, and implement the projects forcefully. This BLOG dedicates to investigate the opportunities, risks, and costs of foreign direct investment (FDI) in U.S.


The most compelling reason to invest in U.S. is MARKET. U.S. market is one of the most large and important markets in the world. Almost every recognized international brand in every industry wants a strong presence in U.S. market, such as Sony, Toyota, Siemens, BMW, and UBS etc. The list can go on and on. Entering U.S. market is one of the necessary steps for an ambitious business organization. Even under current severe recession and with American consumers tightening their belts, U.S. market is still one of the most vital places for global vendors.


Of course, the huge size of U.S. market itself is not the sufficient reason for foreigners to invest in U.S. During the past three decades, world exporters tried very hard to penetrate U.S. market and largely succeed in general. Just look at the annual U.S. total imports. However, for many suppliers, simply producing goods in their own factories and shipping the goods through oceans to U.S. are no longer good enough, or safe enough. The reason is PROTECTIONISM.


U.S., though always promoting free trade around the world, has a history of protectionism. One example is “Smoot-Hartley Act” during the Great Depression. A more recent example is the import tariff toward Japanese automobiles in 1980s. Does anyone forget “the Plaza Accord” on September 22, 1985? This is not to criticize the U.S.’s protectionism policy or its hypocrite attitude toward free trade, but rather simply state the obvious fact. When time is bad, protectionism is always the first and the most popular weapon that the government can deploy. Anyone who is not total ignorant can bet that the world is entering a stage of protectionism.
Facing the harsh reality, what should our producers do? Of course I think that one should always focus on its domestic market first. Support your own people. But would you rather let your rivalry take advantage the recession to grab more market shares and grow their businesses in the largest market in the world, while you are rejected by the trade barrier? Protect your marketplace and keep your access to market safe. This is the single biggest reason why you should consider invest your money in U.S.


Another reason of investing in U.S. is technology. U.S., while is gradually losing its edge in several technologic fronts, is still enjoying huge leads in many fields, such as energy efficiency, electronic engineering, bioengineering, heavy mechanics, aviation and aerospace technology. To shorten the technologic gap, investing in U.S., especially merger and acquisition, is essential to obtain the important intellectual patents and engineering know-how.
Also, U.S. has a largest pool of talents in the world. It is relatively easier to find qualified engineers, scientists, marketing experts, and managers. Usually it is quite expensive to hire American skilled employees. But under the current recessionary circumstance, you will be in a strong position to take advantage of this employer’s market. It would be a good strategy if you can hire some essential employees and transfer their know-how and experiences into the institutional knowledge of your organization.


There are many other reasons of investing in U.S. that are cited by those consulting companies, such as capital availability (usually true, but not so distinguished from many other regions in the world nowadays), political stability (NOT automatically translated to low political risks, especially for foreigners), transparent and fair legal system (but complicated and expensive, could be a huge disadvantage to foreigners), integrated internal market (mostly true, but depending on industry), and ample natural resources (true but not so cheap). This post won’t analyze everyone of them. There are also numerous downsides of investing in U.S., largely due to the cultural gaps and the higher costs to manufacture goods and provide services in the states.


Again, make carefully calculation before you move, the winners of this recession will not only survive but also dominate in the future.